Explaining the high M2/GDP ratio in China: a Credit Creation Perspective
China’s fast-growing M2/GDP ratio has puzzled policy-makers and investors for years. I recently read a book by former Chinese central bankers who explain it from a credit creation perspective. Here are a snapshot of their analysis and some data verification.
Recently, I read the book Credit Creation, Money and Economic Structure (信用创造、货币供求与经济结构) by Bin Li and Ge Wu, who were former officials at The People’s Bank of China (PBC) or the Chinese central bank. It was written in 2014 since the aftermath of the global financial crisis changed the economic and financial situation in China. The book starts with discussing how the broadly defined money, mostly referred as M2, is created from the central bank or the money supply process. Then it analyzes what factors influence the money demand function and the associated equilibrium outcomes with a focus of China. Throughout the book, it emphasizes a structuralism perspective that takes into account the “structural change and its corollary, industrial upgrading” happening in many developing countries (Lin, (2011)).
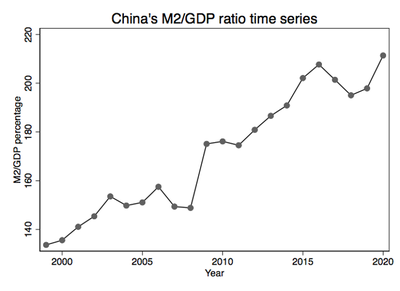
I find the authors’ analysis on China’s high M2/GDP ratio very convincing and, importantly, well-supported by data. To provide the context, according to the World Bank’s data, China’s M2/GDP ratio hits 211.3% in 2020, making it the No.3 in the world slightly below Hong Kong and Macao. For comparison, China’s M2/GDP ratio is almost twice of that of the U.S. (111.3%) and far bigger than the global average (85.0%). More than that, as shown in the figure below, we see that the ratio nearly doubled itself as China entered the 20th century. As a result, investors start to worry that such high M2/GDP indicates an excessive money supply in China, which will create asset bubbles (e.g., in real estate) and increase corporate leverage, leading to higher financial risks.
Economists proposed various explanations on China’s high M2/GDP ratio. What I will discuss here, as called by the authors, is the financing structure-saving rate framework. As a preliminary, we need to first understand how the broadly defined money or M2 (basically physical currency plus deposits) is created within the modern banking system. In a nutshell, the central bank first provides the base money to commercial banks, and the commercial banks use them to conduct for-profit, balance-sheet expansion activities by issuing loans, purchasing foreign exchange and bonds etc. Throughout this process, as a result of banks’ accounting practice, deposits are recorded on the liability side that counts as M2 creation.
To illustrate, consider a guy depositing $100 cash to commercial bank A from selling a bond to the central bank and assume banks’ required reserve ratio is 20%. Bank A’s simplified initial balance sheet looks like:
| Assets | Liabilities |
|---|---|
| Required reserves $20 | Deposits $100 |
| Excess reserve $80 |
Assuming Bank A uses the excess reserve to issue a $80 loan, its balance sheet becomes:
| Assets | Liabilities |
|---|---|
| Loan $80 | Deposits $180=100+80 |
| Required reserves $36=180*20 | |
| Excess reserve $64 |
Since deposits is an integral part of M2, in the loan-issuing process, money supply increased by 80 because of bank A’s balance sheet expansion. Similarly, purchasing foreign exchanges or bonds has the same effect. Let us assume Bank A further purchases foreign exchanges worth of 120, and then its balance sheet looks like:
| Assets | Liabilities |
|---|---|
| Foreign exchanges $120 | Deposits $300=100+80+120 |
| Loan $80 | |
| Required reserves $60=300*20 | |
| Excess reserve $40 |
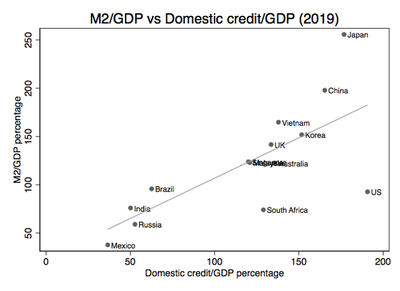
From the simple illustration, we observe that a commercial bank’s asset expansion operations will directly infuse money into the system, which makes it a very special economic entity. One direct implication from this observation is that, when a firm decides to finance itself through bank loans, as opposed to direct financing like issuing stocks or bonds, the total money supply will increase in the society. As we see, when a firm acquires a loan from a bank, a deposit will be created on the bank’s balance sheet, increasing the total money supply. But when a firm finances directly through issuing bonds or stocks, the fund is not touched by the banking system but only transferred between individuals and/or other firms, keeping the total money supply constant. As a result, when a country has more firms dependent on bank financing to raise capital, the country will likely have more money created relative to peers (with similar amounts of real economic activities as measured by GDP), thus a higher M2/GDP ratio. Empirically, we find there is a positive relationship between the M2/GDP ratio and the domestic credit/GDP ratio as shown below. The sample includes China and other 16 major economic entities for the 2019 data from the World Bank.
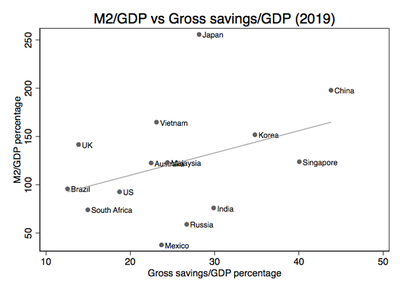
But the explanation from financing structure alone may not be enough. There are still unanswered questions like why, fundamentally, firms rely more on bank financing and why, in terms of the mechanism, M2 grows faster than GDP when firms decides on more bank financing. Here we need to bring up the other key variable, saving rate, to answer the question. According to the theory, saving rate can affect the M2/GDP ratio in two ways. First, a high saving rate means that, when new money comes into circulation, there will be relatively more of it staying in banks’ vaults serving as a storage of value. However, note that, only money that is used in transactions can help support real economic activities and increase GDP. As a result, a high saving rate will cause the speed of M2’ s increase larger than that of GDP’s increase, driving up the M2/GDP ratio. Second, when people save more in banks, they have less money to invest in stocks and bonds. Therefore, firms will face more difficulties in direct financing and have to turn to banks. As discussed earlier, issuance of new loans will create new money supply, increasing the M2/GDP ratio. Looking at data from the World Bank, I plot the M2/GDP ratio and the gross savings/GDP ratio and indeed find a positive relationship.
To further evaluate this framework’s explainatory power, I run the following simple panel data regression model covering sample from 1999-2020 of 17 large economic entities (China, the U.S., the Euro area, the U.K., Japan, South Korea, Australia, Brazil, Russia, Canada, India, South Africa, Singapore, Malaysia and Vietnam): \begin{equation} M_{it} = a_t + b_1*C_{it} + b_2*S_{it} + b_3*F_{it} + e_{it} \end{equation} where $M_{it}$ is the M2/GDP ratio, $C_{it}$ is the domestic credit/GDP ratio, $S_{it}$ is the gross savings/GDP ratio and $F_{it}$ is the foreign exchange reserve/GDP ratio. Note that, as discussed earlier, most of banks asset expansion activities (e.g., issue loans, purchase bonds and foreign reserves) will create new money supply. The regressor foreign exchange reserve/GDP ratio thus aims to capture the effect of purchasing foreign reserves on banks’ balance sheet. The following table shows the result:
| Dependent variable: M2/GDP | |
|---|---|
| Domestic credit/GDP | 0.630*** |
| (0.0403) | |
| Gross savings/GDP | 1.538*** |
| (0.273) | |
| FX reserves/GDP | 0.0982 |
| (0.138) | |
| N | 270 |
| adj. R-sq | 0.915 |
| F statistics | 121.56*** |
| Standard errors in parentheses: | * p<0.05, ** p<0.01, *** p<0.001 |
We observe that both domestic credit/GDP and gross savings/GDP ratios are positively correlated with the M2/GDP ratio with statistical significance. Specifically, when domestic credit ratio and saving rate increase by 1 percent, the M2/GDP ratio of the economic entity will increase by 0.6 and 1.5 percent respectively. The foreign reserves/GDP ratio, despite having a positive correlation coefficient as expected, does not achieve statistical significance in this specification. Overall, the model seems to have a very good fit with the data as suggested by the very high R^2 (~90%) and significant F statistics.
To summarize, in this book, the authors offered a very interesting analysis on the process of money creation and used it to explain various economic phenomena like countrys’ different M2/GDP ratios. Here, we see that a bank-dominated financing structure and a high saving rate will drive up the M2/GDP ratio, both theoretically and empirically. In the early 20th century of China, its under-developed financial market and special regulatory structure led to both a reliance on bank financing and a high saving rate. Looking ahead, as China further adjusts its economic structure, develops and opens up its financial market, we would expect more diverse financing options for firms and less reliance on bank financing. At the same time, Chinese people will have more investment portfolio options and stronger consumption growth, driving down the saving rate. All these factors would predict a slowing-down of the M2/GDP growth for China as it enters into a more developed economy.
Lastly, I want to mention that what I discussed is just a sub-chapter of the book. Reading the whole book will be very enlightening if you are interested in monetary economics, central banking or the Chinese economy. Unfortunately, the book only has a Chinese version right now, but I hope an English version will come soon as more readers appreciate its wisdom. Also, I will be thrilled to learn more about how the money creation process can be incorporated into modern quantitative macro models and whether those models yield the same conclusion as my simple regression suggests.
Reference:
Lin, Justin Yifu. “New structural economics: A framework for rethinking development.” The World Bank Research Observer 26.2 (2011): 193-221.